From 1928-2017 the value premium in the US had a positive annualized return of approximately 3.5%. In seven of the last 10 calendar years, however, the value premium in the US has been negative.
This has prompted some investors to wonder if such an extended period of underperformance may be cause for concern. But are periods of underperformance in the value premium that unusual? We can look to history to help make sense of this question.
SHORT-TERM RESULTS
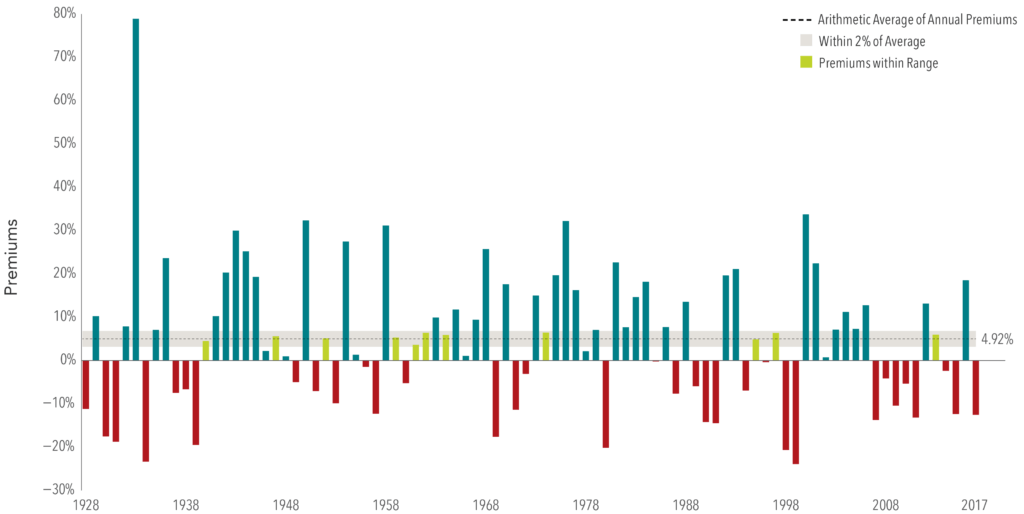
Exhibit 1 shows yearly observations of the US value premium going back to 1928. We can see the annual arithmetic average for the premium is close to 5%, but in any given year the premium has varied widely, sometimes experiencing extreme positive or negative performance. In fact, there are only a handful of years that were within a 2% range of the annual average—most other years were farther above or below the mean. In the last 10 years alone there have been premium observations that were negative, positive, and in line with the historical average. This data helps illustrate that there is a significant amount of variability around how long it may take a positive value premium to materialize.
Exhibit 1: Yearly Observations of Premiums
Value minus Growth: US Markets, 1928-2017
LONG-TERM RESULTS
Exhibit 2: Historical Observations of 10-Year Premiums
Value minus Growth: US Markets 10-Year Periods ending 1937-2017
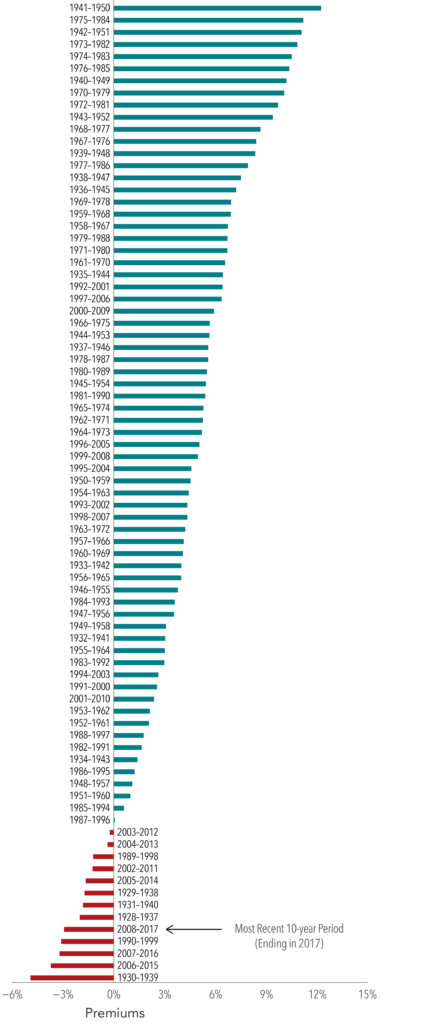
But what about longer-term underperformance? While the current stretch of extended underperformance for the value premium may be disappointing, it is not unprecedented. Exhibit 2 documents 10-year annualized performance periods for the value premium, sorted from lowest to highest by end
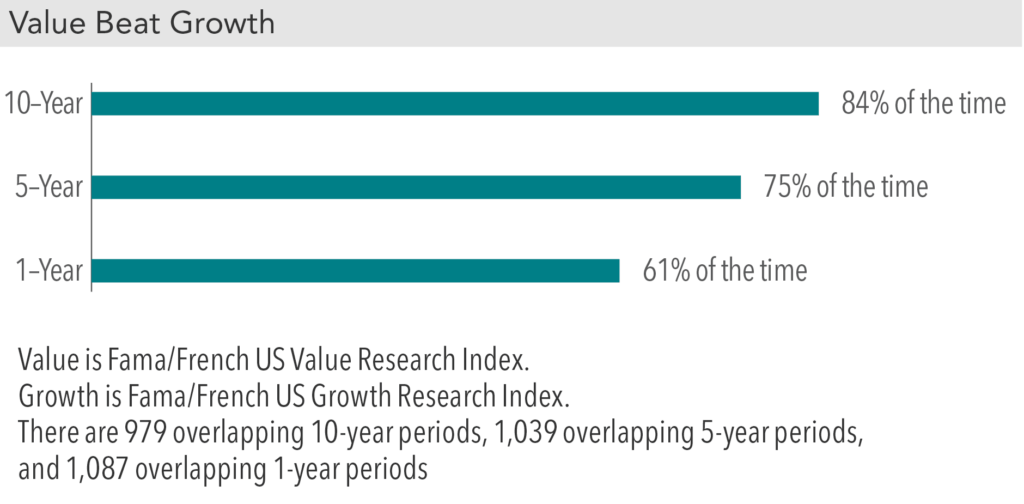
While there is uncertainty around how long periods of underperformance may last, historically the frequency of a positive value premium has increased over longer time horizons. Exhibit 3 shows the percentage of time that the value premium was positive over different time periods going back to 1926. When the length of time measured increased, the chance of a positive value premium increased.
For example, when the time period measured goes from five years to 10 years, the frequency of positive average premiums increased from 75% to 84%.
Exhibit 3: Historical Performance of Premiums over Rolling Periods
July 1926-December 2017
CONCLUSION
What does all of this mean for investors? While a positive value premium is never guaranteed, the premium has historically had a greater chance of being positive the longer the time horizon observed. Even with long-term positive results though, periods of extended underperformance can happen from time to time. Because the value premium has not historically materialized in a steady or predictable fashion, a consistent investment approach that maintains emphasis on value stocks in all market environments may allow investors to more reliably capture the premium over the long run. Additionally, keeping implementation costs low and integrating multiple dimensions of expected stock returns (such as size and profitability) can improve the consistency of expected outperformance.
Source: Dimensional Fund Advisors LP.
Past performance is not a guarantee of future results. Indices are not available for direct investment. Their performance does not reflect the expenses associated with the management of an actual portfolio.
There is no guarantee investment strategies will be successful. Investing involves risks including possible loss of principal. Investors should talk to their financial advisor prior to making any investment decision. There is always the risk that an investor may lose money. A long-term investment approach cannot guarantee a profit.
All expressions of opinion are subject to change. This article is distributed for informational purposes, and it is not to be construed as an offer, solicitation, recommendation, or endorsement of any particular security, products, or services. Investors should talk to their financial advisor prior to making any investment decision.
Fama/French Indices—Results prior to each index’s inception date do not represent actual returns of the respective index. Other periods selected may have different results, including losses. Backtested index performance is hypothetical and is provided for informational purposes only to indicate historical performance had the index been calculated over the relevant time periods. Backtested performance results assume the reinvestment of dividends and capital gains.distributed for informational purposes, and it is not to be construed as an offer, solicitation, recommendation, or endorsement of any particular security, products, or services. Investors should talk to their financial advisor prior to making any investment decision.